Thinking about buying or holding a small storefront or mixed‑use building in Downtown or East Austin? The cap rate on a flyer looks straightforward, but it can hide big assumptions about risk, taxes, and turnover. You want clear, local guidance that helps you price today’s income and tomorrow’s work. In this guide, you’ll learn cap rate basics in plain English, how urban core assets in Austin price risk, and practical underwriting adjustments to make before you write an offer. Let’s dive in.
Cap rate, in plain English
Cap rate tells you the unlevered return on a property’s current income stream. The basic formula is simple: Cap rate = Net Operating Income ÷ Purchase Price. It helps you compare properties quickly and translate income into value.
Going‑in vs exit vs cash‑on‑cash
- Going‑in cap rate uses the first stabilized year of NOI divided by the purchase price.
- Exit cap rate is the rate you assume at sale to estimate terminal value.
- Cash‑on‑cash measures annual cash flow after debt service divided by equity invested.
- IRR captures timing and size of cash flows across the full hold period, including sale.
Limits you should respect
Cap rate ignores leverage, the timing of cash flows, and capital expenditures. Two properties at the same cap can carry very different risks based on tenant credit, lease terms, and capex backlog. Market cap rates move with interest rates, liquidity, and local demand, so using stale caps can misprice value.
How Austin’s urban core prices risk
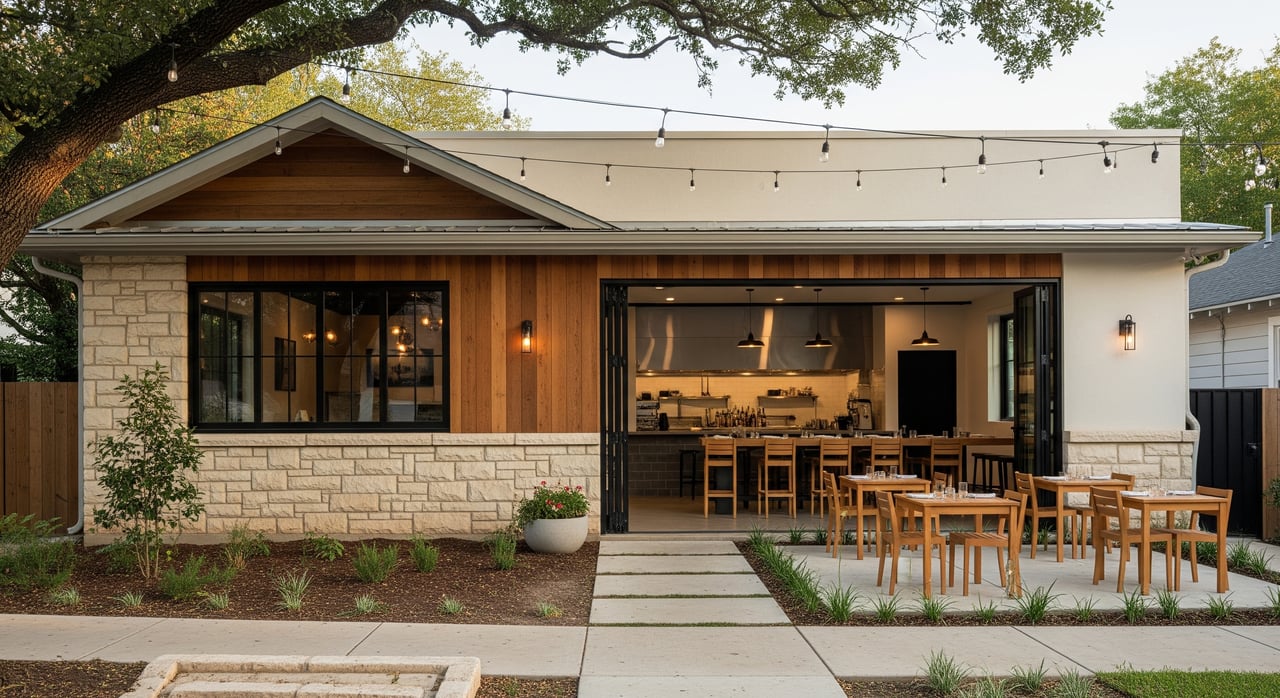
Downtown and East Austin are highly walkable and dense, but each submarket behaves differently. Downtown storefronts benefit from proximity to office towers, entertainment districts, and hotels, yet reduced daytime office use can pressure categories like coffee and quick service. East Austin draws strong neighborhood demand and higher rents on key corridors, though turnover can be faster and community sensitivities can shape leasing and approvals.
Rising interest rates in 2022–2023 pushed cap rates higher in many markets and widened bid‑ask spreads. In Austin, capital market liquidity and lending terms remain major drivers of where cap rates clear.
Value drivers to watch
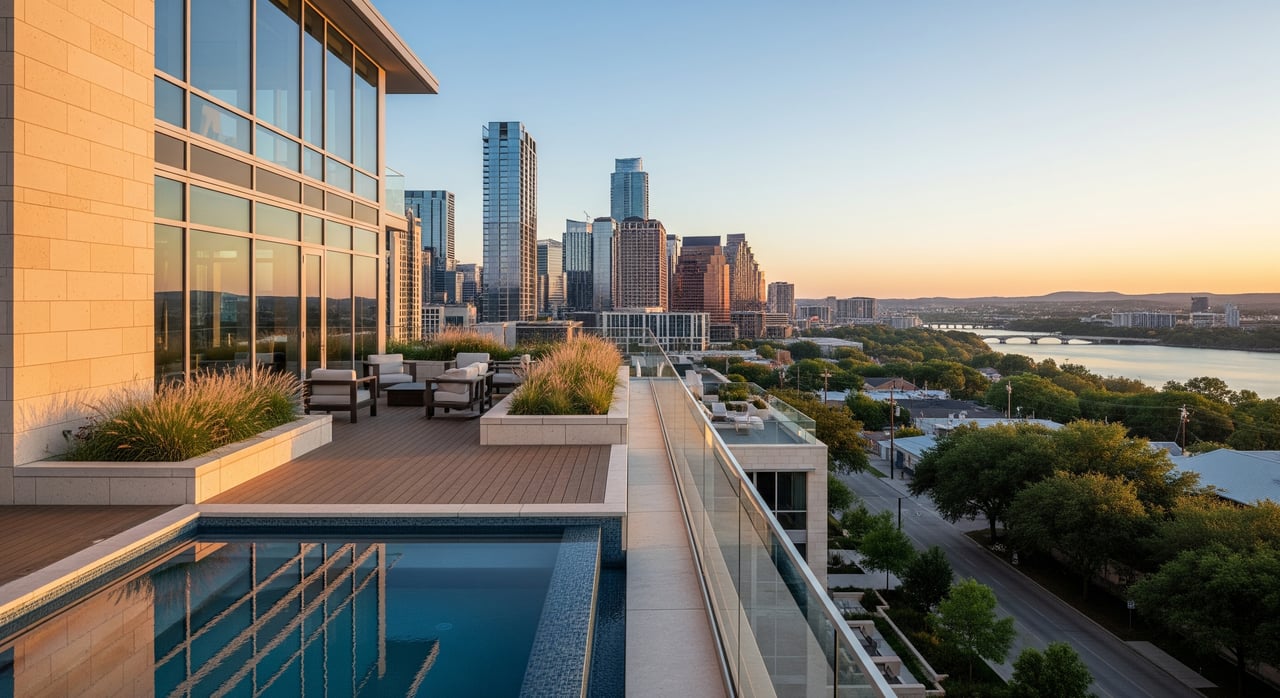
- Location and foot traffic. Proximity to office clusters, Sixth Street, Rainey, and dense residential blocks supports retail rents and NOI stability.
- Tenant mix and lease structure. National credit on NNN is lower risk than a short, modified‑gross lease with a local operator.
- Rent per square foot and growth. Tech employment, universities, and tourism influence baseline demand and rate growth expectations.
- Physical condition and program. Adaptive‑reuse buildings offer character and upside, but often carry higher maintenance and capex.
- Regulatory and permitting. Historic overlays, site plan rules, and building code upgrades affect timelines and costs.
Asset‑specific takeaways
- Small urban retail. Strengths include visibility and walkability. Risks include reliance on daytime office workers downtown, limited parking, and shorter lease terms for local operators. Expect modified gross for small tenants and NNN for nationals.
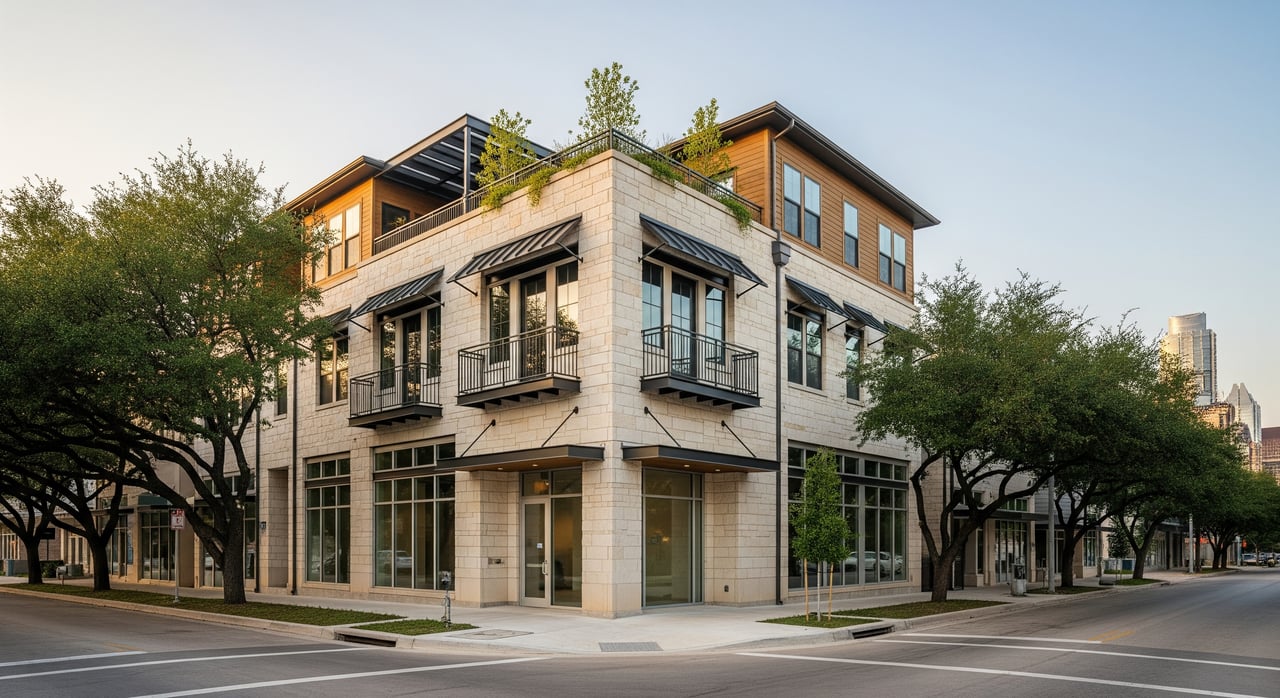
- Mixed‑use. Residential income can stabilize cash flow while retail provides upside. Operations are more complex due to split expenses and code or parking requirements.
- Adaptive reuse. Unique product and value‑add potential, paired with hidden capital needs like MEP, ADA, HVAC, longer permitting, and possible historic restrictions.
From broker pro forma to realistic underwriting
Start with the broker’s pro forma and rebuild it with conservative, local inputs. Your goal is a believable going‑in cap rate that reflects turnover, taxes, and capital needs typical of small urban assets in Austin.
A stepwise approach
- Begin with the pro forma NOI and line‑item assumptions.
- Verify in‑place rents, lease expirations, expense recoveries, and any base‑year structures.
- Set vacancy and credit loss to a realistic neighborhood level for tenant mix and category risk.
- Audit operating expenses, focusing on property taxes, insurance, utilities, CAM, management, and repairs.
- Add reserves for replacements, near‑term capex, and leasing costs like TI and commissions.
- Recompute NOI, derive the going‑in cap, then run sensitivities for vacancy, rent growth, and exit cap.
Vacancy and credit loss
Broker pro formas often understate turnover for small retail and mixed‑use. Adjust for category risk and seasonality, and include a premium for local tenant credit. Food and beverage concepts often have higher turnover than service retail.
Operating expenses and taxes
Confirm which expenses are truly recoverable. Many small tenants are on modified gross or single‑net structures and may not accept full escalations. For taxes, verify parcel history with the Travis Central Appraisal District and apply current city, county, and school rates. Plan for protest timing, but do not assume immediate reductions.
- Use TCAD to review assessed values and tax history. You can search parcels and exemptions through the Travis Central Appraisal District.
- For statewide property tax guidance and rules on taxable valuation, see the Texas Comptroller’s property tax resources.
Reserves and capital expenditures
Set an annual reserve for replacements like roof and HVAC, plus a larger near‑term bucket for deferred maintenance. Adaptive‑reuse assets often warrant a higher initial reserve due to age, building systems, and code updates.
Leasing costs
Small‑tenant turnover can meaningfully impact cash flow. Budget realistic TI and leasing commissions, especially for creative office conversions and restaurant buildouts, which can be expensive.
Management and overhead
Even if you self‑manage, include a line item for management time or a third‑party fee. Local complexity, permitting, and coordination across uses can add time and cost.
A quick illustrative example
If a broker shows NOI of 100,000 dollars on a 1,500,000 dollar price, the going‑in cap is 6.67 percent. After raising vacancy, adding reserves, annualizing TI and commissions, and updating taxes from parcel history, your adjusted NOI might be 85,000 dollars. That implies a 5.67 percent cap. This simple step shows how fast returns can change when you model real costs.
Stress‑test your numbers
Run three scenarios that vary vacancy, rent growth, and the exit cap within realistic bands. Calculate break‑even occupancy after debt service so you know your downside. Build a lease roll with turnover probabilities by tenant and a 5 to 10 year capital plan for big replacements.
Owner‑operators often accept lower going‑in caps if they can lift NOI through hands‑on leasing or modest repositions. Make sure your model includes the true time cost of operations, plus the property tax exposure that comes with no state income tax in Texas.
Local tools and contacts
Reliable local inputs make for better underwriting. These resources can help you validate assumptions and timing in Austin’s core.
- For zoning, historic overlays, permits, and timelines, use the City of Austin Planning and Development Review resources.
- Access parcel data, assessed values, and tax history at the Travis Central Appraisal District.
- Review statewide property tax rules with the Texas Comptroller’s property tax guidance.
- For regional employment and business climate context, see Austin Chamber economic development insights.
- For underwriting fundamentals, explore CCIM Institute resources.
- For national commercial trends and commentary, see NAR commercial insights and NAIOP research.
- For regional real estate statistics and summaries, review Austin Board of Realtors market stats.
Putting it all together
A cap rate is a helpful snapshot, but it is only the start. In Downtown and East Austin, risk and value hinge on tenant mix, lease structures, operating recovery, and the true cost of keeping older buildings competitive. If you build your own NOI from the leases up, right‑size vacancy and reserves, and run a few sensible scenarios, you will be positioned to buy well and operate with confidence.
If you want hands‑on help with underwriting, leasing strategy, permitting, or repositioning in Austin’s urban core, we are here to be a long‑term partner. Reach out to Lead Commercial. Let’s talk about your property.
FAQs
What is a cap rate in commercial real estate?
- It is the property’s unlevered yield calculated as Net Operating Income divided by purchase price, useful for comparing income streams across assets and markets.
How do cap rates reflect risk in Downtown and East Austin?
- They adjust for tenant credit, lease term, turnover, location, and capital needs, with downtown office usage and East Austin neighborhood dynamics shaping rent stability.
What adjustments should I make to a broker pro forma in Austin?
- Increase vacancy and credit loss to realistic neighborhood levels, verify tax history with TCAD, add reserves and leasing costs, and confirm which expenses are actually recoverable.
How should I model property taxes for a Travis County building?
- Pull parcel history from the Travis Central Appraisal District, apply current rates, model assessment growth, and plan for protest timing without assuming immediate reductions.
Is an adaptive‑reuse project worth the extra capex and time?
- It can be if repositioning yields rent premiums or stronger demand, but you should budget higher upfront capex, longer permitting, and potential historic restrictions before you buy.